
Insights

We introduce Cumulative Benchmark Divergence (CBD), a new way of assessing corporate climate targets that should help investors to better identify transition risk in their assets and portfolios.
Our CBD approach measures the difference between the decarbonisation trajectory implied by a company’s emissions target and a climate benchmark over the whole pathway.
This cumulative perspective better aligns with the way that emissions impact the climate. Over 2019-2050, a company which delays emissions reductions until 2049 and then reduces by 100% will emit two and a half times the amount of carbon of a company decarbonising by 7% annually.
Using this approach, investors can better understand whether a company’s decarbonisation ambitions are sufficient to meet the net zero goal.
Cumulative emissions determine warming
To manage their risks and inform their engagement activities, investors need to assess if the emissions targets set by the companies in their portfolio are consistent with the pace of action required to prevent catastrophic climate change.
Current assessments are typically made by comparing the relative position of a company’s emissions pathway to a climate benchmark at specific points in time.
However, it is cumulative emissions, rather than emissions in any one year, that determine the degree of warming. This point is regularly emphasised by the UN’s Intergovernmental Panel on Climate Change (IPCC).
Therefore, an approach which focuses on cumulative emissions can more accurately assess if a company’s activities are consistent with a climate goal, improving an investor’s ability to understand transition risk.
How CBD works
This approach compares a company emissions targets to the relevant climate benchmark across the whole pathway. The outcome is expressed in a single percentage figure, indicating the degree of (mis)alignment between the two. Effectively the “gap” between the company emissions pathway and the climate benchmark.
CBD can be calculated using publicly available data, such as that from the Transition Pathway Initiative (TPI), and can be based on carbon intensity or absolute emissions metrics. Our examples use carbon intensity, but the full paper explains the strengths and weaknesses of both approaches.
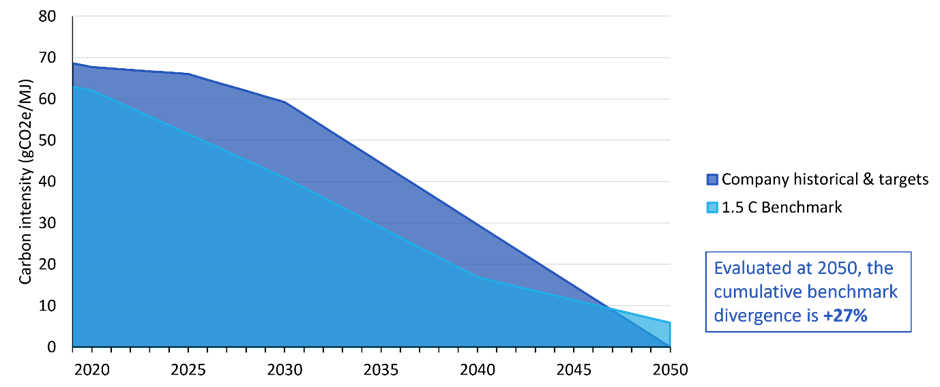
The further the company pathway (dark blue) is above the benchmark (light blue), the less aligned its emissions targets are and the higher its CBD score will be. A zero or negative CBD score indicates that the company emissions targets are aligned with a climate benchmark.
As well as the greater alignment with climate science, this approach also makes it easier to quantifiably compare multiple companies. The chart below is based on TPI data and shows projected emissions pathways for four electricity utilities alongside the relevant sector benchmark.
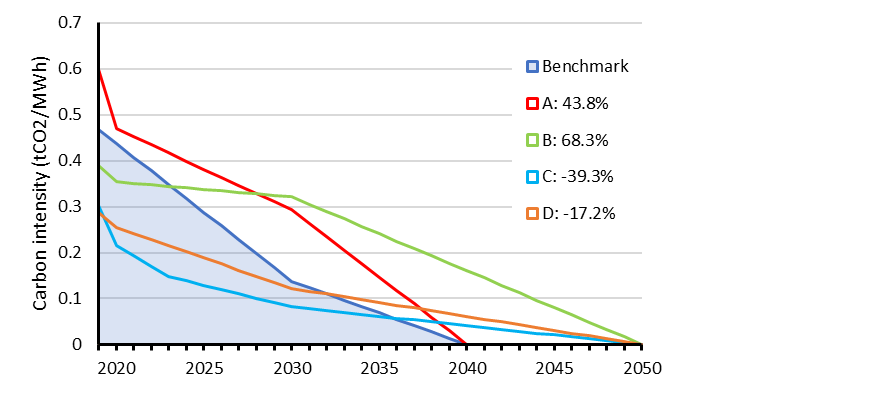
Company A begins above the benchmark while company B begins below. However, company A’s targets are more ambitious – it is aiming for net zero by 2040, ten years before B.
Over the entire 2020-2050 timeline, the area under A’s pathway is less than B’s and therefore its CBD score is lower (43.8% vs 68.3%). However, as both scores are positive, neither can be considered aligned with the benchmark.
Company C and D have similar starting points, with carbon intensity lower than the benchmark. While they have the same long-term target, company C has more ambitious short and medium-term targets than D, resulting in a lower CBD score (-39.3% vs -17.2%).
As both scores are lower than zero, their pathways can be considered aligned.
Up to portfolio level
CBD can also be used to assess the overall alignment of investor portfolios. This can be done by weighting individual company-level scores and aggregating these up to portfolio level.
This briefing focuses on the application of CBD to companies, but in future the methodology could be applied beyond company targets to other asset classes such as real estate or sovereign debt.
We believe that CBD can complement existing approaches to portfolio alignment including financed emissions, portfolio coverage, and the alignment maturity scale used by the Net Zero Investment Framework (NZIF).
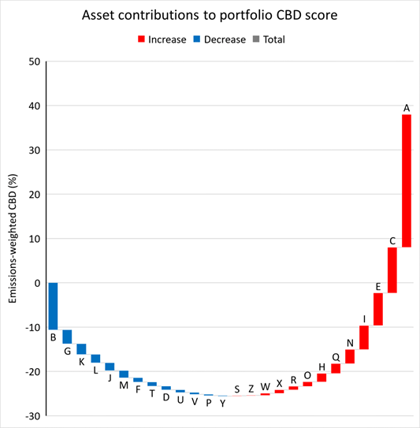
Investors can interrogate an overall portfolio CBD score to assess what fraction qualifies as aligned, as well as the contribution each company makes to the total score. This asset-level breakdown could help investors to prioritise engagement and improve decision-making.
Our initial analysis highlights that portfolio results are particularly sensitive to the scores of companies representing the largest share of owned emissions. Aligned emission-intensive companies improve the score (Company B) and misaligned emission-intensive companies weaken it (Company A), demonstrated below.
What next?
There is good reason to be optimistic about the potential of CBD. It fundamentally improves the assessment of company emissions targets and investors could use it to inform asset allocation and engagement activities, such as Climate Action 100+ and the new Net Zero Engagement Initiative.
It can be implemented today and, whilst data availability is relatively low, coverage is set to expand significantly. Assessments are already available for the most emissions-intensive companies.
IIGCC members: Check your member newsletter from 15 February for implementation guidance and example templates.
CBD also has potential at a portfolio level and across multiple asset classes. Aggregating asset-level scores can provide a clearer view of portfolio alignment and supplement existing portfolio target-setting approaches.
In future it could be integrated with NZIF, but more research and consideration is needed. This report is likely to be the first step of a journey. We intend to hone this methodology, working with our members and incorporating feedback as understanding develops.
If you’d like to take part in our working groups and help to shape the outputs of our resources, why not speak to our investor relations manager today to find out more about becoming a part of IIGCC?